What ROAS is and what counts as a good figure
«Our ROAS is 1000%!» says a business owner — and that can mean either a fantastic result or loss-making advertising. It all depends on how they calculated it and what their margin is.
ROAS (Return on Ad Spend) is probably the most widely used metric in performance advertising. Everyone knows it; very few read it correctly. In this article we break down, without the padding, what it actually measures, how to calculate it, what counts as «good» for your niche — and when the pretty number in the dashboard is lying to you.
What ROAS is: the formula and the mechanics
ROAS (Return on Ad Spend) is the revenue generated by advertising divided by what you spent on that advertising. It shows how many hryvnias (or dollars) of revenue you get for every hryvnia of ad budget.
The formula:
ROAS = (Revenue from advertising / Advertising spend) × 100%
Or as a multiple:
ROAS = Revenue from advertising / Advertising spend
A concrete example: You spent $1,000 on Meta Ads and generated $5,000 in revenue from those ads.
- ROAS = ($5,000 / $1,000) × 100% = 500%
- Or: $5,000 / $1,000 = 5x (every hryvnia invested brought back five)
Both formats describe the same thing. Percentages are used more often in Meta Ads and agency reports; the multiple (x) appears in the Google dashboard.
What counts as «revenue from advertising»? For online stores, it is the total value of purchases tracked through the Meta pixel or the Google Ads tag. For service businesses with no direct online purchases, ROAS is calculated from average order value and the number of deals attributed to advertising.
One key nuance that many businesses miss: ROAS is a revenue metric, not a profit metric. It says nothing about what you actually earned after deducting cost of goods and operating expenses. More on that below.
How to calculate ROAS: real examples
The theory is simple — let’s look at practice from real cases.
Case — an online store of pet accessories. Our client WAUDOG (accessories and gear for dogs), over a single advertising month:
- Meta Ads spend: ~$1,560
- Revenue from advertising: ~$8,010 (730 confirmed sales)
- ROAS = 513%
Those 513% mean every dollar invested came back fivefold and then some. For pet products in e-commerce, that is a strong result. But reaching that figure required a clear funnel: the right campaign structure, segmented audiences, A/B testing of creatives and retargeting of people who added to cart but did not buy.
Case — a vinyl record store. Our client Play Vinyl sells a niche product to a narrow but loyal audience. What makes this case notable is channel synergy: Meta Ads built familiarity and warmed the audience, while Google Ads closed those who returned with intent to buy. The result: ROAS on Google Ads came in well above target, because those people had already been warmed up on social. Each channel alone would have looked weaker; together they formed a system.
Important: Meta Ads calculates ROAS only from the conversions it tracks itself — sometimes overstating them because of cross-device journeys and attribution windows (by default, 7 days after a click plus 1 day after a view). Google Analytics or your CRM will show «colder» but more honest figures. If you see a gap between the dashboard and the CRM, that is normal — but you need to understand why it exists.
What ROAS counts as good — and why there is no single answer
The most common mistake is comparing your ROAS against a «market norm» without accounting for your own margin. A ROAS of 300% can be excellent for one business and a disaster for another.
How to calculate your minimum profitable ROAS (break-even):
Break-even ROAS = 100% / Gross margin
Example: your margin is 35% (out of every $100 in revenue, $35 remains after cost of goods). Then:
- Break-even ROAS = 100% / 35% = ~286%
At a ROAS of 250% with a 35% margin, the advertising is loss-making, even though it looks «in the black».
But break-even is not the goal. On top of it you have to add the agency’s or media buyer’s fee, operating costs and logistics. A realistic target ROAS is usually 150–200 percentage points above break-even.
Benchmarks by niche (general guidance):
| Niche | Margin (approx.) | Break-even ROAS | Target ROAS |
|---|---|---|---|
| Cosmetics / beauty | 50–70% | 143–200% | 500–900% |
| Clothing / footwear / accessories | 40–60% | 167–250% | 400–700% |
| Homeware / decor | 35–55% | 182–286% | 350–600% |
| Pet accessories | 40–55% | 182–250% | 450–650% |
| Electronics | 10–20% | 500–1000% | 800%+ |
| Beauty services / fitness | 60–80% | 125–167% | 250–450% |
| B2B / high-value services | 40–70% | 143–250% | 150–300%* |
*In B2B and high-value services ROAS is lower, but each client is worth considerably more (LTV). Here the deal value and CAC (customer acquisition cost) matter more than ROAS as such.
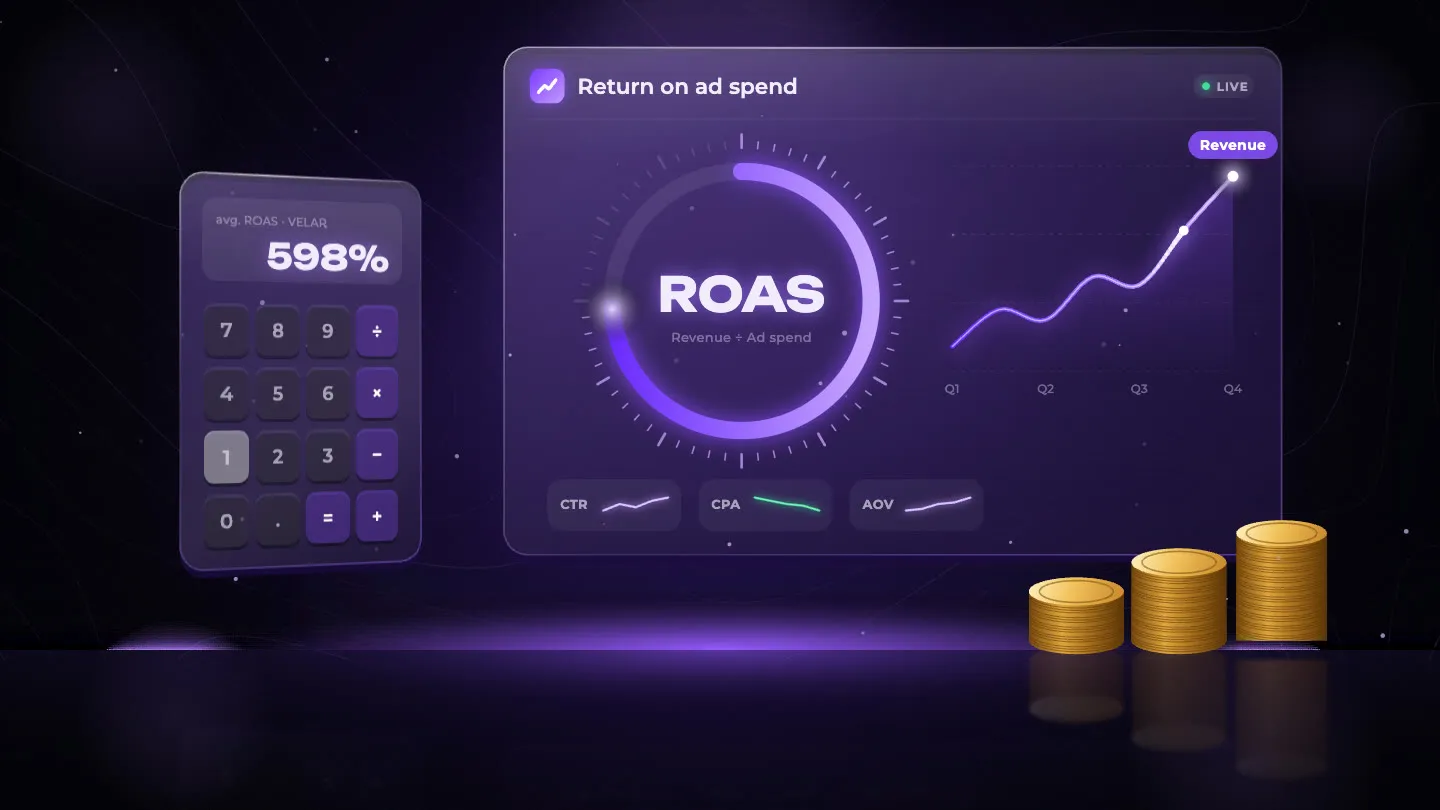
VELAR’s position: a «good ROAS» is not an abstract number, but one that covers your margin with enough headroom for operating costs and growth. Our own benchmark for e-commerce clients starts at 400%, with a target of 500–700% in stable campaigns. The weighted average ROAS across all active VELAR clients is 598%.
Three ROAS traps: when the pretty number is lying to you
ROAS is a useful metric, but it has three serious blind spots that agencies rarely talk about.
Trap 1. Dashboard ROAS ≠ real profitability
Meta and Google count only the conversions they can «see» through their pixel or tag. The typical problems:
- Attribution windows: by default Meta claims a sale that happens within 7 days of a click. If Google Ads is running in parallel, both channels can claim the same sale.
- Cross-device: the buyer saw the ad on mobile and bought on desktop — the conversion is untracked or tracked incorrectly.
- Offline: phone orders, in-store pickup, cash on delivery — the dashboard sees none of it.
The fix: calculate Blended ROAS (or MER — Marketing Efficiency Ratio):
MER = Total business revenue / Total advertising spend × 100%
If your Meta dashboard ROAS is 700% but your business-wide MER is 320%, you need to work out why the gap exists. Perhaps Meta was taking attribution away from Google, or a significant share of sales happens offline.
Trap 2. ROAS does not account for all costs
Advertising is only one of your costs. To get to real profit from advertising you still have to subtract:
- Cost of goods (COGS) — for electronics at a 15% margin, a ROAS of 600% actually leaves you at a loss.
- Logistics and returns — especially critical in clothing, where returns can reach 25–30%.
- The agency’s or media buyer’s fee — that is a marketing cost too.
- Operating costs — warehousing, packaging, order processing.
This is why advanced teams calculate nROAS (net ROAS) — (revenue minus cost of goods) / advertising spend. Or ROMI (Return on Marketing Investment) — (gross profit minus marketing costs) / marketing costs.
Trap 3. Optimising for ROAS can kill your growth
When you set an overly aggressive target ROAS (tROAS) in Google or Meta, the algorithm starts shrinking reach — showing ads only to the hottest buyers. You get fewer sales, but «more efficient» ones. The business does not grow; it simply skims the existing demand.
We see this regularly in practice: a client sets tROAS to 900%, the dashboard shows a beautiful figure — but total sales volume drops by 30–40%, new audiences go untouched and the brand is not being built.
A comparison of the key advertising efficiency metrics:
| Metric | What it measures | Pros | Cons |
|---|---|---|---|
| ROAS (dashboard) | Revenue / ad spend | Simple, fast | Overstates, ignores cost of goods |
| Blended ROAS / MER | All revenue / all ad spend | Honest, multi-channel | Does not show the effect of a specific channel |
| nROAS | (Revenue − COGS) / ad spend | Closer to profit | Requires accurate COGS accounting |
| ROMI | (Profit − costs) / costs | The most complete | Hard to calculate in real time |
| CAC | Customer acquisition cost | Critical for subscriptions and B2B | Does not reflect volume |
What actually moves ROAS — 5 key levers
If your ROAS is below target, it is almost always one, or a combination, of five factors:
1. Weak creative. In Meta Ads, 60–70% of the result is determined by the quality of the ad. A video that «stops the thumb» and immediately shows the product’s value converts many times better than a static banner with a logo and a slogan. If ROAS is sagging, the first thing we check is what the ad looks like and whether CTR is above 1.5%.
2. An uncompetitive offer. Even perfect advertising will not sell a product priced above the market or presented without a clear call to action. ROAS starts with unit economics: do you have a tangible advantage (price, delivery terms, uniqueness), and is it obvious in the ad?
3. A weak landing page. The advertising brought the customer — and the site is slow, confusing or not adapted for mobile. Conversion falls, cost per purchase rises, ROAS falls accordingly. A strong, fast, clear landing page is a big topic in its own right; we cover it in our websites-for-advertising service.
4. No retargeting, or weak retargeting. Most people do not buy the first time they see an ad — especially in niches with expensive products. Retargeting (showing ads to people who already visited the site, viewed a product or added to cart) is the cheapest way to lift overall ROAS. In typical VELAR strategies, retargeting campaigns deliver a ROAS 3–5 times higher than cold-audience campaigns.
5. Broken attribution and a broken pixel. Sometimes «low ROAS» is simply a broken pixel or duplicated conversion events. Checking the technical tracking is the first step before optimising any campaign.
How we measure ROAS at VELAR — and why we do not «paint» numbers
We have a clear position that we state to clients from the first meeting: we report in real money, not in pretty dashboard figures.
Our approach, in three steps:
Step 1 — attribution audit before launch. We check that the pixel is set up correctly, that all the necessary events are tracked and that there are no duplicates. Without this, any ROAS figure is garbage in, garbage out.
Step 2 — we set a target ROAS against the client’s margin. Not «the higher the better», but specifically: here is your 40% margin, here is your break-even ROAS of 250%, here is our target for month one, 380%, and our target in the stable phase, 500%+. That gives the client a clear answer to when the advertising turned a profit.
Step 3 — we calculate MER in parallel. Every month we compare dashboard ROAS against the business’s actual revenue. If the gap is larger than 25–30%, we find out where attribution is lying.
The numbers across VELAR clients:
- Weighted average ROAS: 598%
- Revenue generated for clients: over $5,560,000
- Niches: 55+ (from fashion and beauty to B2B and construction materials)
These figures do not come from a dashboard where you can pick a flattering attribution window. They are cross-checked against CRMs and client reporting.
If you want to understand what ROAS is realistic for your niche and where your break-even point sits right now, we start with a free audit. In an hour-long call we will show you your current attribution, where the budget is leaking and what target we set for month one.
And if you are still deciding which channel to start with — Meta Ads or Google Ads — read «Meta Ads or Google Ads: which to choose for your business». For how much budget to set aside at the beginning, see «How much targeted advertising costs».
Frequently asked questions
What is ROAS and how is it calculated?
ROAS (Return on Ad Spend) is the return on your advertising spend. The formula: ROAS = Revenue from advertising ÷ Advertising spend × 100%. If you spent $1,000 and generated $5,000 in revenue, your ROAS is 500%, or 5x.
What ROAS is considered good?
It depends on your niche and your margin. There is one key rule: ROAS has to exceed your break-even point — that is, 100% ÷ your margin. At a 30% margin, the minimum profitable ROAS is around 333%. For e-commerce clothing and accessories the target ROAS is 400–700%; for services, 200–400%.
How does ROAS differ from ROI?
ROI (Return on Investment) accounts for ALL business costs — production, logistics, staff, advertising. ROAS accounts only for advertising spend against the revenue it generated. Two businesses can have the same ROAS but different ROI if one has a higher cost of goods.
Can I trust the ROAS shown in the Meta or Google dashboard?
Partly. Dashboard ROAS counts only the conversions the platform can «see» through its pixel or tag. It does not account for offline sales, phone orders or cross-channel attribution. For the full picture you need Blended ROAS or MER — total business revenue ÷ total advertising spend.